Attention: Please take a moment to consider our terms and conditions before posting.
League One xG table
Comments
-
Those early 2000s sides even in the prem, most of which took a kick off, passed it back to the right back, who then hoofed it forward to the tallest player up front. Would get absolutely annihilated by today’s top teams who are heavily data focused.Covered End said:
Early 2000s perhaps.Callumcafc said:
I think we should go one further and do away with all stats including possession, shots and corners.Covered End said:
It's really useful that xG has identified this.seriously_red said:
Both opta analyst and footballxg.com calculate a table based upon expected points. They also offer a prediction for 46 games. However, we haven't played nearly enough games for that prediction to stand up to scrutiny.MrOneLung said:can someone actually post the league table based on xG ?
That is, after all the point of the thread
The point about xG is that it takes 25-30 data points per game, and not just the goals. It can therefore be useful to judge over ten games and compare vs:
- the competition
- previous seasons
- changes when there's a change in management, or players in/out due to transfers or injury
There will always be outliers, but most clubs will revert to their mean. If a club is outperforming xG then the choice is to ride out their luck, change approach, accept a downturn, or acquire / rehabilitate players.
In our case, Leaburn and Edwards are now available, and we require a win away to Stevenage or Bristol Rovers so as to stay in the frame. Should we win one plus our performances and xG improve then the bookies will perhaps place us back as one of the six favourites for a top six finish?
The point being that the bookies and xG are both independent of any Charlton bias, thus giving us a view which isn't distorted by our own views and emotions when watching the games.
What matters is that Nathan Jones needs to find away to create more, decent chances without compromising the serious progress made in defence. We've made some inroads with set pieces - whether one uses anecdotes or xG our attacking threat is roughly half our competition!
No one else had noticed.
Let's just go back to the early 1900s and focus on the final score and vibes only.0 -
“Why’s Ngolo Kante got a km tracker attached to him! We can see he runs a lot, what a load a nonsense!”
”What about the times when his team loses, could it be because Kante and the other players didn’t work as hard?”
”WHAT A LOAD OF NONSENSE! 😡 “0 -
BR7_addick said:“Why’s Ngolo Kante got a km tracker attached to him! We can see he runs a lot, what a load a nonsense!”
”What about the times when his team loses, could it be because Kante and the other players didn’t work as hard?”
”WHAT A LOAD OF NONSENSE! 😡 “
2 -
Strangely there were a fair few people on here a week or so ago saying xG was nonsense and everything was perfect because we were 2nd in the league.Covered End said:
It's really useful that xG has identified this.seriously_red said:
Both opta analyst and footballxg.com calculate a table based upon expected points. They also offer a prediction for 46 games. However, we haven't played nearly enough games for that prediction to stand up to scrutiny.MrOneLung said:can someone actually post the league table based on xG ?
That is, after all the point of the thread
The point about xG is that it takes 25-30 data points per game, and not just the goals. It can therefore be useful to judge over ten games and compare vs:
- the competition
- previous seasons
- changes when there's a change in management, or players in/out due to transfers or injury
There will always be outliers, but most clubs will revert to their mean. If a club is outperforming xG then the choice is to ride out their luck, change approach, accept a downturn, or acquire / rehabilitate players.
In our case, Leaburn and Edwards are now available, and we require a win away to Stevenage or Bristol Rovers so as to stay in the frame. Should we win one plus our performances and xG improve then the bookies will perhaps place us back as one of the six favourites for a top six finish?
The point being that the bookies and xG are both independent of any Charlton bias, thus giving us a view which isn't distorted by our own views and emotions when watching the games.
What matters is that Nathan Jones needs to find away to create more, decent chances without compromising the serious progress made in defence. We've made some inroads with set pieces - whether one uses anecdotes or xG our attacking threat is roughly half our competition!
No one else had noticed.
Now after a bad result or 2, xG was telling us everything we already knew!2 -
I'd like you to find one quote where someone said everything was perfect and post it here .........balham red said:
Strangely there were a fair few people on here a week or so ago saying xG was nonsense and everything was perfect because we were 2nd in the league.Covered End said:
It's really useful that xG has identified this.seriously_red said:
Both opta analyst and footballxg.com calculate a table based upon expected points. They also offer a prediction for 46 games. However, we haven't played nearly enough games for that prediction to stand up to scrutiny.MrOneLung said:can someone actually post the league table based on xG ?
That is, after all the point of the thread
The point about xG is that it takes 25-30 data points per game, and not just the goals. It can therefore be useful to judge over ten games and compare vs:
- the competition
- previous seasons
- changes when there's a change in management, or players in/out due to transfers or injury
There will always be outliers, but most clubs will revert to their mean. If a club is outperforming xG then the choice is to ride out their luck, change approach, accept a downturn, or acquire / rehabilitate players.
In our case, Leaburn and Edwards are now available, and we require a win away to Stevenage or Bristol Rovers so as to stay in the frame. Should we win one plus our performances and xG improve then the bookies will perhaps place us back as one of the six favourites for a top six finish?
The point being that the bookies and xG are both independent of any Charlton bias, thus giving us a view which isn't distorted by our own views and emotions when watching the games.
What matters is that Nathan Jones needs to find away to create more, decent chances without compromising the serious progress made in defence. We've made some inroads with set pieces - whether one uses anecdotes or xG our attacking threat is roughly half our competition!
No one else had noticed.
Now after a bad result or 2, xG was telling us everything we already knew!
(apart from Ronnie Moore who simply trolls).
I think most fans said, even before the season started, that we had little creativity in midfield, lacked fire power up front and would probably struggle to score a lot of goals.
The majority had us down to finish 6th at best and more likely 8th-12th.3 -
Surley being perfect would be 1st rather than 2nd?balham red said:
Strangely there were a fair few people on here a week or so ago saying xG was nonsense and everything was perfect because we were 2nd in the league.Covered End said:
It's really useful that xG has identified this.seriously_red said:
Both opta analyst and footballxg.com calculate a table based upon expected points. They also offer a prediction for 46 games. However, we haven't played nearly enough games for that prediction to stand up to scrutiny.MrOneLung said:can someone actually post the league table based on xG ?
That is, after all the point of the thread
The point about xG is that it takes 25-30 data points per game, and not just the goals. It can therefore be useful to judge over ten games and compare vs:
- the competition
- previous seasons
- changes when there's a change in management, or players in/out due to transfers or injury
There will always be outliers, but most clubs will revert to their mean. If a club is outperforming xG then the choice is to ride out their luck, change approach, accept a downturn, or acquire / rehabilitate players.
In our case, Leaburn and Edwards are now available, and we require a win away to Stevenage or Bristol Rovers so as to stay in the frame. Should we win one plus our performances and xG improve then the bookies will perhaps place us back as one of the six favourites for a top six finish?
The point being that the bookies and xG are both independent of any Charlton bias, thus giving us a view which isn't distorted by our own views and emotions when watching the games.
What matters is that Nathan Jones needs to find away to create more, decent chances without compromising the serious progress made in defence. We've made some inroads with set pieces - whether one uses anecdotes or xG our attacking threat is roughly half our competition!
No one else had noticed.
Now after a bad result or 2, xG was telling us everything we already knew!
0 -
Bottom line is it’s just a stat. Building an xG difference league table is not dissimilar to building a goal difference league table, for example.It’s relatively new & more complex and therefore easily misunderstood even by people who love it but end up drawing completely the wrong conclusions from it.It’s just a stat. It’s not going to be for everyone and if that’s you then fair enough.1
-
But do make sure that you keep posting on this thread every week to remind everyone it's not for you, just in case any of us forget.Callumcafc said:Bottom line is it’s just a stat. Building an xG difference league table is not dissimilar to building a goal difference league table, for example.It’s relatively new & more complex and therefore easily misunderstood even by people who love it but end up drawing completely the wrong conclusions from it.It’s just a stat. It’s not going to be for everyone and if that’s you then fair enough.
7 -
Are you telling me if I come on the xg thread there’ll be stuff about xg , fuck that more woke nonsense , when will it ever end
sick of reading about this xg4 -
Exactly oohahh
you won’t find me reading this thread, let alone commenting on it2 -
Sponsored links:
-
Ha ha. How dare people criticise the emperor's new clothes on a thread dedicated to the emperor's new clothes.1
-
It's 12 years old, mate.Stig said:Ha ha. How dare people criticise the emperor's new clothes on a thread dedicated to the emperor's new clothes.0 -
No it's not, it started on August 24th...balham red said:
It's 12 years old, mate.Stig said:Ha ha. How dare people criticise the emperor's new clothes on a thread dedicated to the emperor's new clothes.") 1
1 -
Was it though?Henry Irving said:
Except that wasn't the measure, or to be more accurate combined measures, being used earlier in the season.Callumcafc said:Here’s a metric that reflects well on us.Best quality chances created, worst quality chances conceded. #JonesBall
Only team to average more than 0.14 xG per shot taken and less than 0.06 xG per shot conceded.
Quite encouraging that the teams that show up the best in this currently sit 2nd 3rd 4th and 5th. Who knew xG over a stretch of matches might actually be a good indicator of team strength?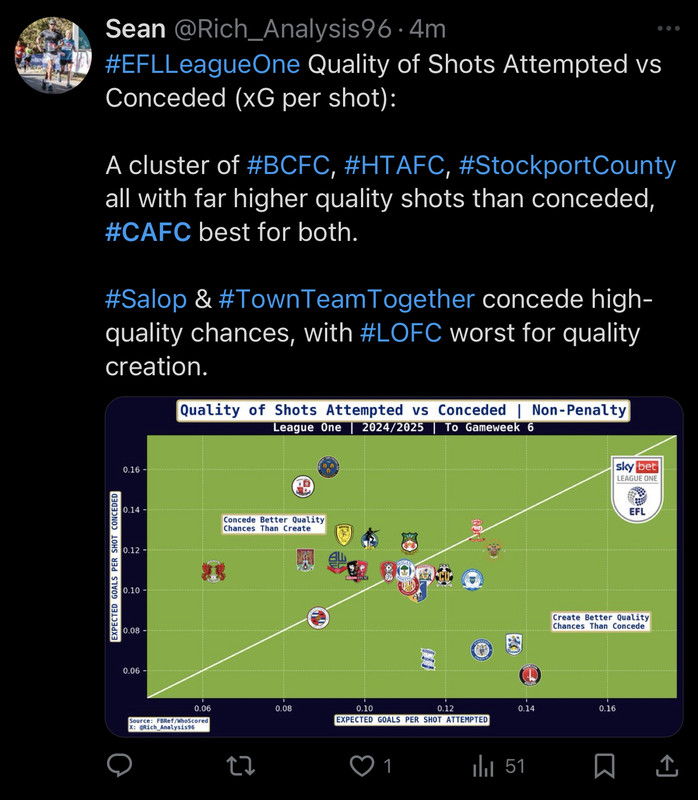
Not just XG but per shots attempted but also quality of chances conceded, which as many pointed out was a clear strength in our early games.
And the best indicator of team strength still remains the league table
Table was saying we were 2nd, xG was saying we were lucky.
Now *that* is the reason why xG is worth looking at.5 -
Is there any correlation between those who love/hate the mention of XG stats to those who love/hate the use of VAR?0
-
I don’t mind a bit of XG I’m a numbers geek and it backed up my view of what I was seeing that we weren’t that good even though we were winning .
as for VAR it depends which team fans suffer at the hands of it it flip side is it brings joy to oppo and I hate everyone1 -
Sorry, another question
in the xG table if in a match the xG is 1.01 versus 1.99 does that go down as a point for a 1-1 draw ?Or does the expected points give the 1.99 a ‘win’0 -
We need more of this type of content. Could work with tactics, signings, managers and so on.Stig said:
Correlation? There's a whole science around the different combinations. Nobody comes out of it well though.Off_it said:Is there any correlation between those who love/hate the mention of XG stats to those who love/hate the use of VAR? 0
0 -
Sponsored links:
-
-
In full awareness that I’m opening myself up for ridicule from certain quarters. If you wanted to be proper nerdy about it and distribute points based on xG… here’s what I’d do.MrOneLung said:Sorry, another question
in the xG table if in a match the xG is 1.01 versus 1.99 does that go down as a point for a 1-1 draw ?Or does the expected points give the 1.99 a ‘win’
Take Stevenage v Charlton yesterday.
Stevenage had 0.50 xG on 11 shots, averaging 0.045 per shot. Charlton had 0.16 xG on 7 shots, averaging 0.023 per shot.
You can use a Binomial distribution to figure out some percentages based on the chances that were created during the 90 mins…
Stevenage: n(shots)=11, p(probability of goal)=0.045
~60% scores 0,
~31% scores 1,
~7% scores 2,
~1% scores 3
and smaller for more…
Charlton: n=7, p=0.023
~84% scores 0,
~14% scores 1,
~1% scores 2
and smaller for more…Then multiply those percentages…
~51% of 0-0,
~26% of 1-0,
~8% of 0-1,
~4% of 1-1,
~6% of 2-0,
~1% of 2-1
and smaller for other results…
Then add up the scorelines to each result…
~33% Stevenage
~55% Draw
~8% Charlton
(yes 4% is missing - because of all the rough calculations I’ve done above)
Then allocate the points based on those outcomes…
Stevenage (3pts * 0.33 + 1pt * 0.55) = 1.54
Charlton (3pts * 0.08 + 1pt * 0.55) = 0.796 -
Callumcafc said:
In full awareness that I’m opening myself up for ridicule from certain quarters. If you wanted to be proper nerdy about it and distribute points based on xG… here’s what I’d do.MrOneLung said:Sorry, another question
in the xG table if in a match the xG is 1.01 versus 1.99 does that go down as a point for a 1-1 draw ?Or does the expected points give the 1.99 a ‘win’
Take Stevenage v Charlton yesterday.
Stevenage had 0.50 xG on 11 shots, averaging 0.045 per shot. Charlton had 0.16 xG on 7 shots, averaging 0.023 per shot.
You can use a Binomial distribution to figure out some percentages based on the chances that were created during the 90 mins…
Stevenage: n(shots)=11, p(probability of goal)=0.045
~60% scores 0,
~31% scores 1,
~7% scores 2,
~1% scores 3
and smaller for more…
Charlton: n=7, p=0.023
~84% scores 0,
~14% scores 1,
~1% scores 2
and smaller for more…Then multiply those percentages…
~51% of 0-0,
~26% of 1-0,
~8% of 0-1,
~4% of 1-1,
~6% of 2-0,
~1% of 2-1
and smaller for other results…
Then add up the scorelines to each result…
~33% Stevenage
~55% Draw
~8% Charlton
(yes 4% is missing - because of all the rough calculations I’ve done above)
Then allocate the points based on those outcomes…
Stevenage (3pts * 0.33 + 1pt * 0.55) = 1.54
Charlton (3pts * 0.08 + 1pt * 0.55) = 0.79
0 -
Callumcafc said:
In full awareness that I’m opening myself up for ridicule from certain quarters. If you wanted to be proper nerdy about it and distribute points based on xG… here’s what I’d do.MrOneLung said:Sorry, another question
in the xG table if in a match the xG is 1.01 versus 1.99 does that go down as a point for a 1-1 draw ?Or does the expected points give the 1.99 a ‘win’
Take Stevenage v Charlton yesterday.
Stevenage had 0.50 xG on 11 shots, averaging 0.045 per shot. Charlton had 0.16 xG on 7 shots, averaging 0.023 per shot.
You can use a Binomial distribution to figure out some percentages based on the chances that were created during the 90 mins…
Stevenage: n(shots)=11, p(probability of goal)=0.045
~60% scores 0,
~31% scores 1,
~7% scores 2,
~1% scores 3
and smaller for more…
Charlton: n=7, p=0.023
~84% scores 0,
~14% scores 1,
~1% scores 2
and smaller for more…Then multiply those percentages…
~51% of 0-0,
~26% of 1-0,
~8% of 0-1,
~4% of 1-1,
~6% of 2-0,
~1% of 2-1
and smaller for other results…
Then add up the scorelines to each result…
~33% Stevenage
~55% Draw
~8% Charlton
(yes 4% is missing - because of all the rough calculations I’ve done above)
Then allocate the points based on those outcomes…
Stevenage (3pts * 0.33 + 1pt * 0.55) = 1.54
Charlton (3pts * 0.08 + 1pt * 0.55) = 0.79
7 -
Stats backing up our defence is generally solid, just need to work out how to sort out the other end without causing problems
 0
0 -
Also shows how good the Stevenage defence is, obviously we should have still probed more but it’s not like they’re an awful team2
-
*JUST*fenaddick said:Stats backing up our defence is generally solid, just need to work out how to sort out the other end without causing problems0 -
I was never expecting us to score many past a side that contains Piergianni. Still one of the best centre backs in this league. We had no luck against him, again.fenaddick said:Also shows how good the Stevenage defence is, obviously we should have still probed more but it’s not like they’re an awful team
0 -
Haha been waiting for you to bring him up! He was good at the weekend, think it would’ve been good to see him up against Ahadme so I was annoyed about his noseBraziliance said:
I was never expecting us to score many past a side that contains Piergianni. Still one of the best centre backs in this league. We had no luck against him, again.fenaddick said:Also shows how good the Stevenage defence is, obviously we should have still probed more but it’s not like they’re an awful team0 -
He'd have had Ahadme for breakfast, lunch, dinner and dessert.fenaddick said:
Haha been waiting for you to bring him up! He was good at the weekend, think it would’ve been good to see him up against Ahadme so I was annoyed about his noseBraziliance said:
I was never expecting us to score many past a side that contains Piergianni. Still one of the best centre backs in this league. We had no luck against him, again.fenaddick said:Also shows how good the Stevenage defence is, obviously we should have still probed more but it’s not like they’re an awful team
Interesting the Stevenage fan on Charlton Live saying that Piergianni is shipping-tanker-slow. But you'd never notice because of the way Stevenage play.0