Attention: Please take a moment to consider our terms and conditions before posting.
League One xG table
Comments
-
Yes, because a nil - nil draw doesn't generate any points and a 3 - 2 defeat generates more points for you than a 1 - 0 win with 0.01 XGbalham red said:
Thanks for explaining the basics of a league table, but sadly you've missed the point that statistics are more significant with more data points.Henry Irving said:
No need to be so patronising either but you werebalham red said:
Except it's not, at earlier stages of the season.Henry Irving said:
Except that wasn't the measure, or to be more accurate combined measures, being used earlier in the season.Callumcafc said:Here’s a metric that reflects well on us.Best quality chances created, worst quality chances conceded. #JonesBall
Only team to average more than 0.14 xG per shot taken and less than 0.06 xG per shot conceded.
Quite encouraging that the teams that show up the best in this currently sit 2nd 3rd 4th and 5th. Who knew xG over a stretch of matches might actually be a good indicator of team strength?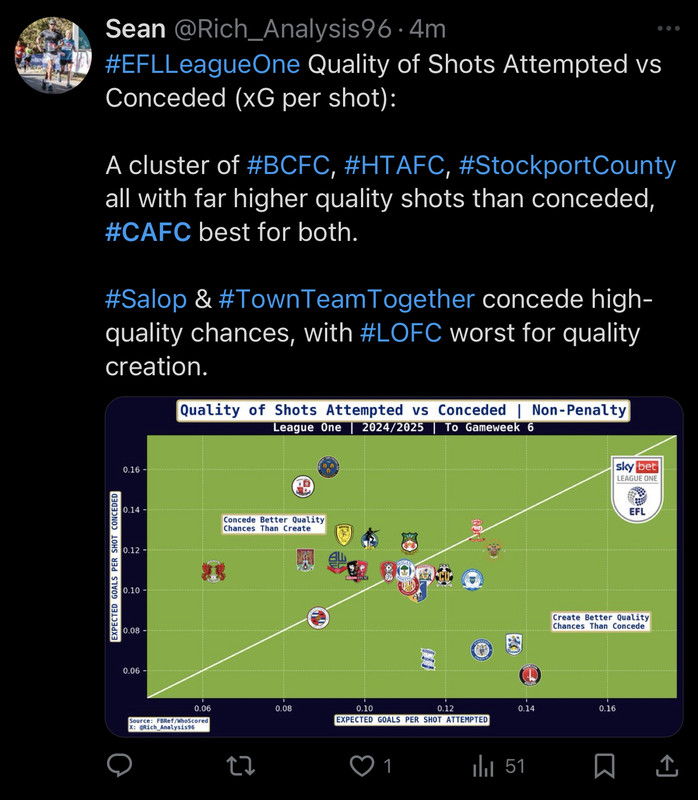
Not just XG but per shots attempted but also quality of chances conceded, which as many pointed out was a clear strength in our early games.
And the best indicator of team strength still remains the league table
Points are won by goals, and since there are few goals in each game, statistically it is not as significant as a softer measure like xG, which has more data points.
It's clear you don't get it which is fine, but there's no need to be so dismissive of something you personally can't see the value in.
And I "get it", I just think it is given fair too much significance, especially when it is used in isolation, as above table and many post on this thread show.
And points are not won by goals as you incorrectly state.
Points are won by winning or drawing games.
That generates points which make up the league table and it's the league table that decides whether you get promoted, relegated or stay in the same division, not XG.
If you couldn't grasp that goals are the drivers of what generates points, then I feel explaining any further would be a fruitless exercise for both of us.
And no matter how many data points you choose the only one that ultimately counts is where you are in the league table at the end of the season.2 -
Definition of 'driver': a factor which causes a particular phenomenon to happen or developHenry Irving said:
Yes, because a nil - nil draw doesn't generate any points and a 3 - 2 defeat generates more points for you than a 1 - 0 win with 0.01 XGbalham red said:
Thanks for explaining the basics of a league table, but sadly you've missed the point that statistics are more significant with more data points.Henry Irving said:
No need to be so patronising either but you werebalham red said:
Except it's not, at earlier stages of the season.Henry Irving said:
Except that wasn't the measure, or to be more accurate combined measures, being used earlier in the season.Callumcafc said:Here’s a metric that reflects well on us.Best quality chances created, worst quality chances conceded. #JonesBall
Only team to average more than 0.14 xG per shot taken and less than 0.06 xG per shot conceded.
Quite encouraging that the teams that show up the best in this currently sit 2nd 3rd 4th and 5th. Who knew xG over a stretch of matches might actually be a good indicator of team strength?
Not just XG but per shots attempted but also quality of chances conceded, which as many pointed out was a clear strength in our early games.
And the best indicator of team strength still remains the league table
Points are won by goals, and since there are few goals in each game, statistically it is not as significant as a softer measure like xG, which has more data points.
It's clear you don't get it which is fine, but there's no need to be so dismissive of something you personally can't see the value in.
And I "get it", I just think it is given fair too much significance, especially when it is used in isolation, as above table and many post on this thread show.
And points are not won by goals as you incorrectly state.
Points are won by winning or drawing games.
That generates points which make up the league table and it's the league table that decides whether you get promoted, relegated or stay in the same division, not XG.
If you couldn't grasp that goals are the drivers of what generates points, then I feel explaining any further would be a fruitless exercise for both of us.
And no matter how many data points you choose the only one that ultimately counts is where you are in the league table at the end of the season.
Hence goals, or the lack thereof, drive the result of the match and therefore the points earned.
And yes, we're all aware that the league table final standings are the ultimate goal.
I'm afraid you're dreadfully missing the point that xG is a statistical indicator of the likelihood of goals (which as previously detailed are the drivers of points), which helps provide an understanding of performance based on a higher number of data points.
Noone in the thread has claimed xG will win you promotion, so you're arguing a point which isn't disputed, while missing the value of statistical analysis.1 -
That table isn't XG, it's average XG per shot.If we have less shots than the opposition, we will still have worse XG, even if our chances are of 'better quality'.We sit 22nd in the table for total shots.0
-
You are right, goals, or the lack thereof, do drive the result of the match and therefore the points earned. Goals. Not expected goals, goals. Goals that are recorded in the league table. As for xG, yes it is "a statistical indicator of the likelihood of goals", but let's think about that statement for a minute, if xG was all it's cracked up to be, you wouldn't be referring to it in the indefinite, you'd be saying that it's, "the statistical indicator of the likelihood of goals". The truth is, there's not one xG but many. In fact, there are as many different versions of xG as there are companies trying to sell football statistics. It is, ultimately, subjectivity wrapped up as objectivity. I'm sure it's got its uses, but the idea that it is as important, or even more important than than the league table is absolutely laughable. I suspect we'll find that it's little more than a fad, like snoods, vapour rub on shirts, nostril tapes, holes in socks and letter-boards for half-time scores. It may be useful in certain circumstances, but please let's stop the pretence that it's the next best thing because it really isn't. At very best, it is what you said it is, an indicator. At worst it is a crushing bore, because it really isn't that important to keep getting mentioned all the time.balham red said:
Definition of 'driver': a factor which causes a particular phenomenon to happen or developHenry Irving said:
Yes, because a nil - nil draw doesn't generate any points and a 3 - 2 defeat generates more points for you than a 1 - 0 win with 0.01 XGbalham red said:
Thanks for explaining the basics of a league table, but sadly you've missed the point that statistics are more significant with more data points.Henry Irving said:
No need to be so patronising either but you werebalham red said:
Except it's not, at earlier stages of the season.Henry Irving said:
Except that wasn't the measure, or to be more accurate combined measures, being used earlier in the season.Callumcafc said:Here’s a metric that reflects well on us.Best quality chances created, worst quality chances conceded. #JonesBall
Only team to average more than 0.14 xG per shot taken and less than 0.06 xG per shot conceded.
Quite encouraging that the teams that show up the best in this currently sit 2nd 3rd 4th and 5th. Who knew xG over a stretch of matches might actually be a good indicator of team strength?
Not just XG but per shots attempted but also quality of chances conceded, which as many pointed out was a clear strength in our early games.
And the best indicator of team strength still remains the league table
Points are won by goals, and since there are few goals in each game, statistically it is not as significant as a softer measure like xG, which has more data points.
It's clear you don't get it which is fine, but there's no need to be so dismissive of something you personally can't see the value in.
And I "get it", I just think it is given fair too much significance, especially when it is used in isolation, as above table and many post on this thread show.
And points are not won by goals as you incorrectly state.
Points are won by winning or drawing games.
That generates points which make up the league table and it's the league table that decides whether you get promoted, relegated or stay in the same division, not XG.
If you couldn't grasp that goals are the drivers of what generates points, then I feel explaining any further would be a fruitless exercise for both of us.
And no matter how many data points you choose the only one that ultimately counts is where you are in the league table at the end of the season.
Hence goals, or the lack thereof, drive the result of the match and therefore the points earned.
And yes, we're all aware that the league table final standings are the ultimate goal.
I'm afraid you're dreadfully missing the point that xG is a statistical indicator of the likelihood of goals (which as previously detailed are the drivers of points), which helps provide an understanding of performance based on a higher number of data points.
Noone in the thread has claimed xG will win you promotion, so you're arguing a point which isn't disputed, while missing the value of statistical analysis.3 -
The Woke Brigade.MrOneLung said:
who defines if a shot is quality, good or just an average shot ?Callumcafc said:Here’s a metric that reflects well on us.Best quality chances created, worst quality chances conceded. #JonesBall
Only team to average more than 0.14 xG per shot taken and less than 0.06 xG per shot conceded.
Quite encouraging that the teams that show up the best in this currently sit 2nd 3rd 4th and 5th. Who knew xG over a stretch of matches might actually be a good indicator of team strength?3 -
Yeah but you can't pretend to be more "sophisticated" by saying "we're higher in the league table."Stig said:
You are right, goals, or the lack thereof, do drive the result of the match and therefore the points earned. Goals. Not expected goals, goals. Goals that are recorded in the league table. As for xG, yes it is "a statistical indicator of the likelihood of goals", but let's think about that statement for a minute, if xG was all it's cracked up to be, you wouldn't be referring to it in the indefinite, you'd be saying that it's, "the statistical indicator of the likelihood of goals". The truth is, there's not one xG but many. In fact, there are as many different versions of xG as there are companies trying to sell football statistics. It is, ultimately, subjectivity wrapped up as objectivity. I'm sure it's got its uses, but the idea that it is as important, or even more important than than the league table is absolutely laughable. I suspect we'll find that it's little more than a fad, like snoods, vapour rub on shirts, nostril tapes, holes in socks and letter-boards for half-time scores. It may be useful in certain circumstances, but please let's stop the pretence that it's the next best thing because it really isn't. At very best, it is what you said it is, an indicator. At worst it is a crushing bore, because it really isn't that important to keep getting mentioned all the time.balham red said:
Definition of 'driver': a factor which causes a particular phenomenon to happen or developHenry Irving said:
Yes, because a nil - nil draw doesn't generate any points and a 3 - 2 defeat generates more points for you than a 1 - 0 win with 0.01 XGbalham red said:
Thanks for explaining the basics of a league table, but sadly you've missed the point that statistics are more significant with more data points.Henry Irving said:
No need to be so patronising either but you werebalham red said:
Except it's not, at earlier stages of the season.Henry Irving said:
Except that wasn't the measure, or to be more accurate combined measures, being used earlier in the season.Callumcafc said:Here’s a metric that reflects well on us.Best quality chances created, worst quality chances conceded. #JonesBall
Only team to average more than 0.14 xG per shot taken and less than 0.06 xG per shot conceded.
Quite encouraging that the teams that show up the best in this currently sit 2nd 3rd 4th and 5th. Who knew xG over a stretch of matches might actually be a good indicator of team strength?
Not just XG but per shots attempted but also quality of chances conceded, which as many pointed out was a clear strength in our early games.
And the best indicator of team strength still remains the league table
Points are won by goals, and since there are few goals in each game, statistically it is not as significant as a softer measure like xG, which has more data points.
It's clear you don't get it which is fine, but there's no need to be so dismissive of something you personally can't see the value in.
And I "get it", I just think it is given fair too much significance, especially when it is used in isolation, as above table and many post on this thread show.
And points are not won by goals as you incorrectly state.
Points are won by winning or drawing games.
That generates points which make up the league table and it's the league table that decides whether you get promoted, relegated or stay in the same division, not XG.
If you couldn't grasp that goals are the drivers of what generates points, then I feel explaining any further would be a fruitless exercise for both of us.
And no matter how many data points you choose the only one that ultimately counts is where you are in the league table at the end of the season.
Hence goals, or the lack thereof, drive the result of the match and therefore the points earned.
And yes, we're all aware that the league table final standings are the ultimate goal.
I'm afraid you're dreadfully missing the point that xG is a statistical indicator of the likelihood of goals (which as previously detailed are the drivers of points), which helps provide an understanding of performance based on a higher number of data points.
Noone in the thread has claimed xG will win you promotion, so you're arguing a point which isn't disputed, while missing the value of statistical analysis.
Next year there will be new stat to get excited about when the reality is "just win games"1 -
Questions to the naysayers above… what did your old dads sneer at when you were younger? Because that’s what you all sound like talking about xG..!

11 -
That would all suggest that we should be down the bottom, surely?balham red said:1 -
We’ll have a better idea over a longer run of games. If it continues like this then it’s a question of whether it’s sustainable.Gribbo said:
That would all suggest that we should be down the bottom, surely?balham red said:0 -
I’ve come to realise that I’m out of touch.
So on Saturday I’m no longer too bothered about winning the game, as long as we can improve our xg ratings.9 -
Sponsored links:
-
We are very unlikely to stay near the top end of the league unless we start creating more chances (more xG). You don’t need xG to realise that, just watching the games would tell you it. But xG is a way of quantifying that into a numberCovered End said:I’ve come to realise that I’m out of touch.
So on Saturday I’m no longer too bothered about winning the game, as long as we can improve our xg ratings.9 -
One day in the future games will be decided by a formula linked to xG. A rebel group of fans will form to bring back games being decided by how many times each team sticks the ball in the net.0
-
Is it? Leaving stats aside, does anyone really believe that the Plymouth team that won League One the season before last was actually a stronger team than the Ipswich team that finished behind them?Henry Irving said:
Except that wasn't the measure, or to be more accurate combined measures, being used earlier in the season.Callumcafc said:Here’s a metric that reflects well on us.Best quality chances created, worst quality chances conceded. #JonesBall
Only team to average more than 0.14 xG per shot taken and less than 0.06 xG per shot conceded.
Quite encouraging that the teams that show up the best in this currently sit 2nd 3rd 4th and 5th. Who knew xG over a stretch of matches might actually be a good indicator of team strength?
Not just XG but per shots attempted but also quality of chances conceded, which as many pointed out was a clear strength in our early games.
And the best indicator of team strength still remains the league table
Most people with eyes in their head were saying that Ipswich were the team to watch, and the underlying numbers (including XG) happened to back them up. Ipswich didn't win the title that year, but went on to smash the Championship the following season, while Plymouth are one of the favourites to be relegated back to League One this year.
There's enough randomness in football that your league position can most definitely not reflect how well or poorly you're actually playing.5 -
Regurgitated from another thread:
There’s quite a bizarre desperation to dismiss xG amongst football fan. It’s not meaningless, the cream of the crop employ all sorts of analysts these days, it’s as important as ever.It’s not supposed to give you an idea of how a game should have gone. It’s supposed to give you an idea of how the next one might go if you don’t tweak something.The more info you have at your disposal the better.9 -
The anti XG dinosaurs are out!3
-
Woke nonsense 😡cafcsinger said:The anti XG dinosaurs are out!3 -
Can I suggest an alteration to the chant of “the read are going up” that could be chanted by the anti XG dinosaurs
“the reds are going up”
even so XG says they not.
Think it fits in quiet well, but to give you an idea of my musical expertise when we had to sing for the school choir after the first note, I was told I would make a good rugby and told to never darken the choir doorstep ever again.0 -
For me the biggest promise with xg is it doesn't take into account how much time and space is created for the goal. For example it's all very good being in a good position, but if a defender is able to get you onto your weak foot, non optimal body position, keeper making himself big, and having to get the shot off quick, that surely affects the chance of goal more than area of shot.Gribbo said:
That would all suggest that we should be down the bottom, surely?balham red said:1 -
I think the misunderstanding of xG and its need for as much data as possible is a major reason for so many football fans disliking it.My problem with it initially was due to only looking at it from the point of view of one game, with the data shown post-match, and the data then posted often looked ridiculous in isolation.I hadn't realised that xG starts to make a lot more sense over a longer period of time, whether that's 10 games, half-a-season, or full season.4
-
My mind is mush and I cannot remember if i've asked this before. But does Xg take into account who it is that has the chance? E.g a 1 on 1 with the goalkeeper would be the same Xg whether it was Lloyd Jones or Mbappe?0
-
Sponsored links:
-
I don’t take too much notice of it, but the fact that clubs analytics departments use it keenly, shows it means something.5
-
There are different models but it tends not to. You will see some strikers who will go through a patch of exceeding their xG. If you tailored it to each player then you wouldn't see (from data alone) who is a good finisher/bad finisherPelling1993 said:My mind is mush and I cannot remember if i've asked this before. But does Xg take into account who it is that has the chance? E.g a 1 on 1 with the goalkeeper would be the same Xg whether it was Lloyd Jones or Mbappe?3 -
I wonder what the xG was for Ebou Adams
 https://www.google.com/search?q=derby+open+goal+miss&oq=derby+open+goal+&gs_lcrp=EgZjaHJvbWUqBggAEAAYAzIGCAAQABgDMgYIARBFGDkyDQgCEAAYhgMYgAQYigUyDQgDEAAYhgMYgAQYigUyCggEEAAYgAQYogQyCggFEAAYgAQYogQyCggGEAAYgAQYogQyCggHEAAYgAQYogQyCggIEAAYgAQYogTSAQgyNzUzajBqN6gCALACAA&sourceid=chrome&ie=UTF-8#fpstate=ive&vld=cid:80affc9f,vid:oYVPScIwvNE,st:0 0
 -
Yes I think XG is supposed to be agnostic with regards to who’s actually taking the chance. It’s typically based on the average expected outcome for a particular chance across an aggregation of allfenaddick said:
There are different models but it tends not to. You will see some strikers who will go through a patch of exceeding their xG. If you tailored it to each player then you wouldn't see (from data alone) who is a good finisher/bad finisherPelling1993 said:My mind is mush and I cannot remember if i've asked this before. But does Xg take into account who it is that has the chance? E.g a 1 on 1 with the goalkeeper would be the same Xg whether it was Lloyd Jones or Mbappe?
similar chances. The added benefit to that is you can use an individual player’s XG (versus their actual goal tally) to assess their finishing. So good finisher should overperform their XG whilst a poor finisher should underpeform it.3 -
The thing about the league table is that it measures the result of every match with 100% accuracy, including all that randomness. Leagues are won on goals. The league table counts everything that the referee says is a goal and it discounts everything that the ref says isn't. It is absolutely perfect for measuring performance as defined by the league over the course of the season and cannot be bettered.
Those who would use xG for such matters are not thinking about what it is or what it does. xG is nothing more than a comparison of what happened against what someone (or some computer) thought ought to happen. It doesn't, and can't by its very nature, take account of that randomness you speak of.
Callum asks, what did our Dads sneer at when we were young? One of the things my dad would sneer at was players failing to score goals from good positions. "I could have put that in from here", he'd say. What he was doing was just an early form of xG. He had an opinion as to how likely a goal would come from any point in play and would be either disappointed or delighted when things didn't play out as he'd thought. Now, that opinion is as valid as a computer model and it is collectively played out in real time at every match. Listen out next time and you'll hear it in the cheers, and jeers and gasps of the fans. Managers will even allude to it in their post match interview, what was the atmosphere like, did the crowd get behind the team? Much of this is about the crowd's expectations. Do they build a league table of this though? Of course they bloody don't. We'll not normally, though there have been attempts to rank it.
Where xG does have some use, just as the oohs and aahs of fans, is in giving managers and coaches a simple language they can use to try and generalise those should-have-scored moments. Specifically two things, are we creating enough of those chances and are we converting enough of them. I suspect it's probably used just as often to publicly paper over the cracks of a poor result - we didn't score, but we had a high xG. As such, xG is an internal indicator of what happens within a game. If coaches find it useful then all well and good. But is absolutely useless as a comparator precisely because it takes no account of all those random factors and because you are not comparing like with like. Building a table out of it is meaningless.
2 -
Not only do I agree with you, but isn't this the whole point of XG? To take a look at (one area of) a teams performance, while eliminating the randomness?Stig said:The thing about the league table is that it measures the result of every match with 100% accuracy, including all that randomness. Leagues are won on goals. The league table counts everything that the referee says is a goal and it discounts everything that the ref says isn't. It is absolutely perfect for measuring performance as defined by the league over the course of the season and cannot be bettered.
Those who would use xG for such matters are not thinking about what it is or what it does. xG is nothing more than a comparison of what happened against what someone (or some computer) thought ought to happen. It doesn't, and can't by its very nature, take account of that randomness you speak of.
The league table is the perfect solution for measuring results, agreed. I don't think anyone is suggesting changing it... but results are a combination of both teams performances and an element of luck/randomness. XG is one of many metrics that tries to understand how a team is performing, while ignoring the impact of luck. It's not a panacea, and it certainly isn't perfect or unarguable, but there's no harm in using it to try and assess how well your team is playing. An XG league table is just one way of illustrating this.
3 -
Were there debates like this when now consisted basic stats started to appear and be talked about more often? Shots, assists, possession, passes, crosses, tackles etc?xG and similar things are just the next evolution of this. They all have their uses and limitations, and can be used effectively or interpreted incorrectly. I don’t think many pro xG are saying it’s perfect, has all the answers or is the most important statistic.3
-
It does not.Pelling1993 said:My mind is mush and I cannot remember if i've asked this before. But does Xg take into account who it is that has the chance? E.g a 1 on 1 with the goalkeeper would be the same Xg whether it was Lloyd Jones or Mbappe?
I guess the way to think about that question would be: does the stat for shots, or shots on target, take into account who has the chance? xG is just another stat in that category attempting to quantify the quality or value of each shot that is taken.You could try and build another model that did add weightings based on player skill but how much variation would there actually be in reality and would it be valuable as a metric?
Clubs use xG to ask “are we creating good enough chances to win games & how can we improve over time?” & not “should we have won or lost that game and where would we be in the table if games were decided on xG?”5 -
Agreed. Just watching the games tells you all you need to know.NabySarr said:
We are very unlikely to stay near the top end of the league unless we start creating more chances (more xG). You don’t need xG to realise that, just watching the games would tell you it. But xG is a way of quantifying that into a numberCovered End said:I’ve come to realise that I’m out of touch.
So on Saturday I’m no longer too bothered about winning the game, as long as we can improve our xg ratings.1 -
I think Stig is onto something here.
Instead of calling it xg let's call it my nan could have scored that etc.
This would definitely make it more interesting.4